EnergyHub Team
April 22, 2024
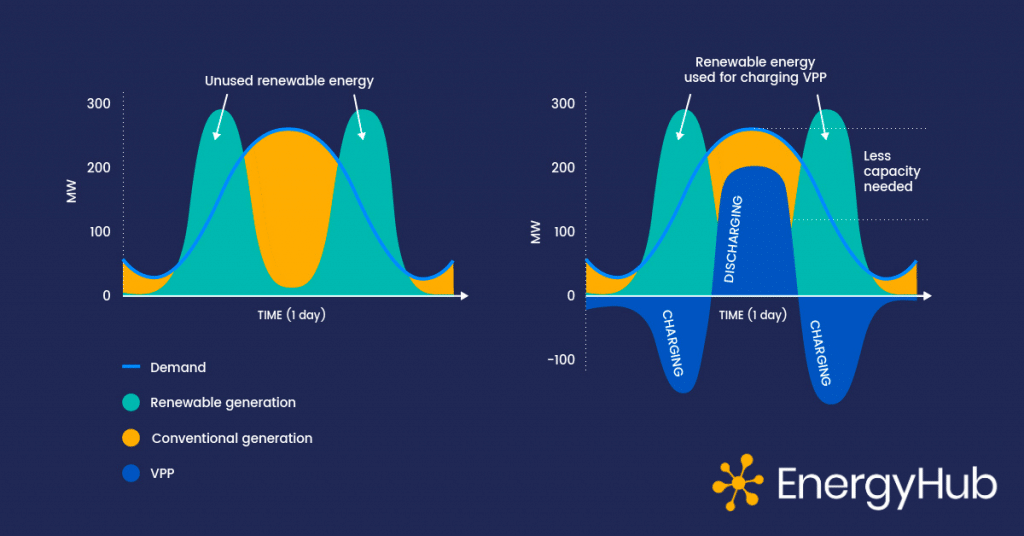
The U.S. government estimates that the electricity industry must add roughly two terawatts of wind and solar generation to decarbonize our electric grid by 2035. Since renewable energy generation is variable by nature, the industry will also need to source as much as 500 gigawatts of flexibility, such as energy storage and responsive demand, to keep the grid reliable.
Many utilities are building virtual power plants (VPPs)—aggregations of distributed energy resources (DERs) that provide grid services—to meet this challenge. VPPs deliver flexibility by coordinating DERs such as thermostats, electric vehicles (EVs), EV charging equipment, energy storage systems, solar inverters, water heaters, and more to address grid constraints. Software from distributed energy resource management system (DERMS) providers like EnergyHub allows utilities to shift power demand when needed to help utilities ensure grid reliability, reduce system costs, and, critically, increase penetration of renewable energy.
Most will agree that flexible load programs can help decarbonize the grid. But accurately accounting for a VPP’s carbon reduction impact is easier said than done. It’s challenging to accurately calculate the emissions produced by the grid with the VPP, and the emissions that would have occurred without it.
“The real-world benefits of demand flexibility extend significantly beyond the direct reduction that occurs as a result of the implemented demand response events,” said EnergyHub’s Paul Hines, VP of Power Systems. “The larger, long-term benefit comes from the fact that virtual power plants enable the transition to a future grid state with enormous amounts of variable wind and solar.”

Calculating the carbon benefit of these programs is critically important to quantify the true impact of demand-side flexibility. EnergyHub’s DataPSI (Data and Power Systems Intelligence) team is spearheading this effort on behalf of our clients and partners looking to meet aggressive decarbonization goals.
Below, we share the most common method utilities use to quantify the “look back” carbon impact of VPP-enabled flexible load programs using U.S.-average marginal emissions or location-specific emissions data. We also share a new, forward-looking calculation that estimates how a program increases overall flexible capacity for renewables.
We propose that without this forward-looking approach, utilities will not be able to fully understand the carbon reduction impact of VPPs.
Two ways to evaluate the carbon impact of flexible load programs
Method 1: Estimate carbon impact of discrete events
The first and simplest way to measure the carbon impact of VPPs is to look at the load shifting (e.g., demand response events) that VPPs have delivered in the past, and then estimate the carbon impact of those DR events. Doing this requires that one estimate what would have happened if the load shifting had not occurred, and then compare the grid emissions between the two cases.
Estimating emissions impacts requires that we use emissions factors that tell us roughly how much emissions are generated by energy consumption at a particular time and location. WattTime, Singularity, and some regional grid operators provide location-based grid emissions data. There is ongoing debate about whether one should use marginal or average emissions, but all of these methods come with significant uncertainty, since it is hard to measure exactly what would have happened to the grid without a particular set of VPP operations.
Method one summarized
- Pros: Method is simple and can be quickly calculated. Using location-specific data generally improves the accuracy of calculations.
- Cons: Because it does not capture the change in generation portfolio that results from the VPP–by adding new types of flexible resources, utilities can build a different type of grid, with lower emissions–it doesn’t necessarily paint the whole picture of emissions avoided through flexible load programs.
- How to use it: Download our Carbon Impact model spreadsheet and customize as needed for your particular application.
Method 2: Estimate avoided emissions of change in generation mix supported by the VPP
Utilities can use Method 1 to estimate emissions reductions from discrete demand response events, such as those that instruct thermostats to pre-cool buildings ahead of and then reduce load during a peak heat event.
However, tallying the avoided emissions from a small number of demand response events (for instance, 10) generally underestimates the overall carbon-reduction potential of a VPP. Why? Because the real value of VPPs comes from unlocking future renewable energy development and reducing the need for additional fossil infrastructure.
If we build a VPP that (perhaps in combination with other infrastructure upgrades) eliminates the need to keep a legacy coal plant online for 20 years past its design life and enables new reliable clean energy development, we eliminate drastically more emissions from the electricity industry, relative to what one would calculate using Method 1. Grid flexibility makes it possible to build a completely different type of electricity system, with dramatically different emissions profiles.
“One of the primary purposes of energy flexibility programs is to enable the grid to operate with large amounts of renewable power without introducing new reliability risks,” said Hines. “Without the flexibility that distributed energy resources provide, it will be difficult or impossible to decarbonize the grid.”
We propose that, in addition to using emissions factors from Method 1, utilities and other VPP developers adopt an additional metric to better understand the long-term carbon reduction value of flexible load programs: compute emissions avoided through a VPP’s ability to unlock renewable generation capacity.
To calculate this value, complete the following steps:
- Estimate the average emissions (not the marginal emissions) of the energy that won’t be needed with increased renewables and flexibility. A simple but useful way to do this is to use the U.S. average emissions (again, not the marginal emissions) factor, which for 2021 was 885 pounds CO2 per megawatt-hour.
- Estimate the VPP’s flexible capacity based on its measured ability to reduce peak or shift loads during peak periods.
- Estimate the renewable capacity unlocked by the flexible capacity. This is the most important and uncertain number in this calculation. In the absence of more detailed data, we typically assume that 1 kW of demand response unblocks 0.5 kW of zero-carbon generation. For resources such as batteries that provide year-round flexibility, we can reasonably increase this to a 1:1 ratio.
- Estimate the capacity factor associated with the renewable capacity (e.g., solar capacity factors are typically in the range of 0.15 – 0.25 and wind capacity factors range from 0.25 – 0.50), and use this to compute the annual energy production from the unlocked renewables.
- Estimate the emissions avoided per year by multiplying the emissions factor from step one by the unlocked annual energy in step four.
Method two summarized
- Pros: Provides a more accurate forward-looking estimate of emissions avoided by flexible load programs.
- Cons: Not yet widely utilized—this metric may be unfamiliar to utility and regulatory stakeholders. The method must be paired with significant renewables development to be accurate. And because it isn’t backward looking, it can’t be used to answer questions about avoided emissions to date.
- How to use it: Download our Carbon Impact model spreadsheet for a rough version of how to implement this method.
A new way to quantify carbon impact
Achieving 100 percent zero-carbon electricity by 2035 while maintaining a reliable supply of power requires an all-hands-on-deck approach. At EnergyHub, we’re committed to supporting our clients in the electricity industry through this process as we make strides toward a carbon-free, distributed energy future. To learn more about how our cross-DER VPP solutions can help your utility decarbonize the grid, get in touch with us today.
Editor’s note: This blog was originally published in 2023 and has been updated for accuracy and comprehensiveness.
Interested in keeping up with the latest dispatch from the grid edge?
Get our next post in your inbox.


